ServiceM8’s reporting has always been simple by design, with key metrics and reports for different areas in your business. But when you wanted to dig deeper, it didn’t have the flexibility to answer your questions. ServiceM8 14 introduces a powerful new reporting engine, letting you analyse almost any data, then filter or break it down your way, to gain the insights you’re after.
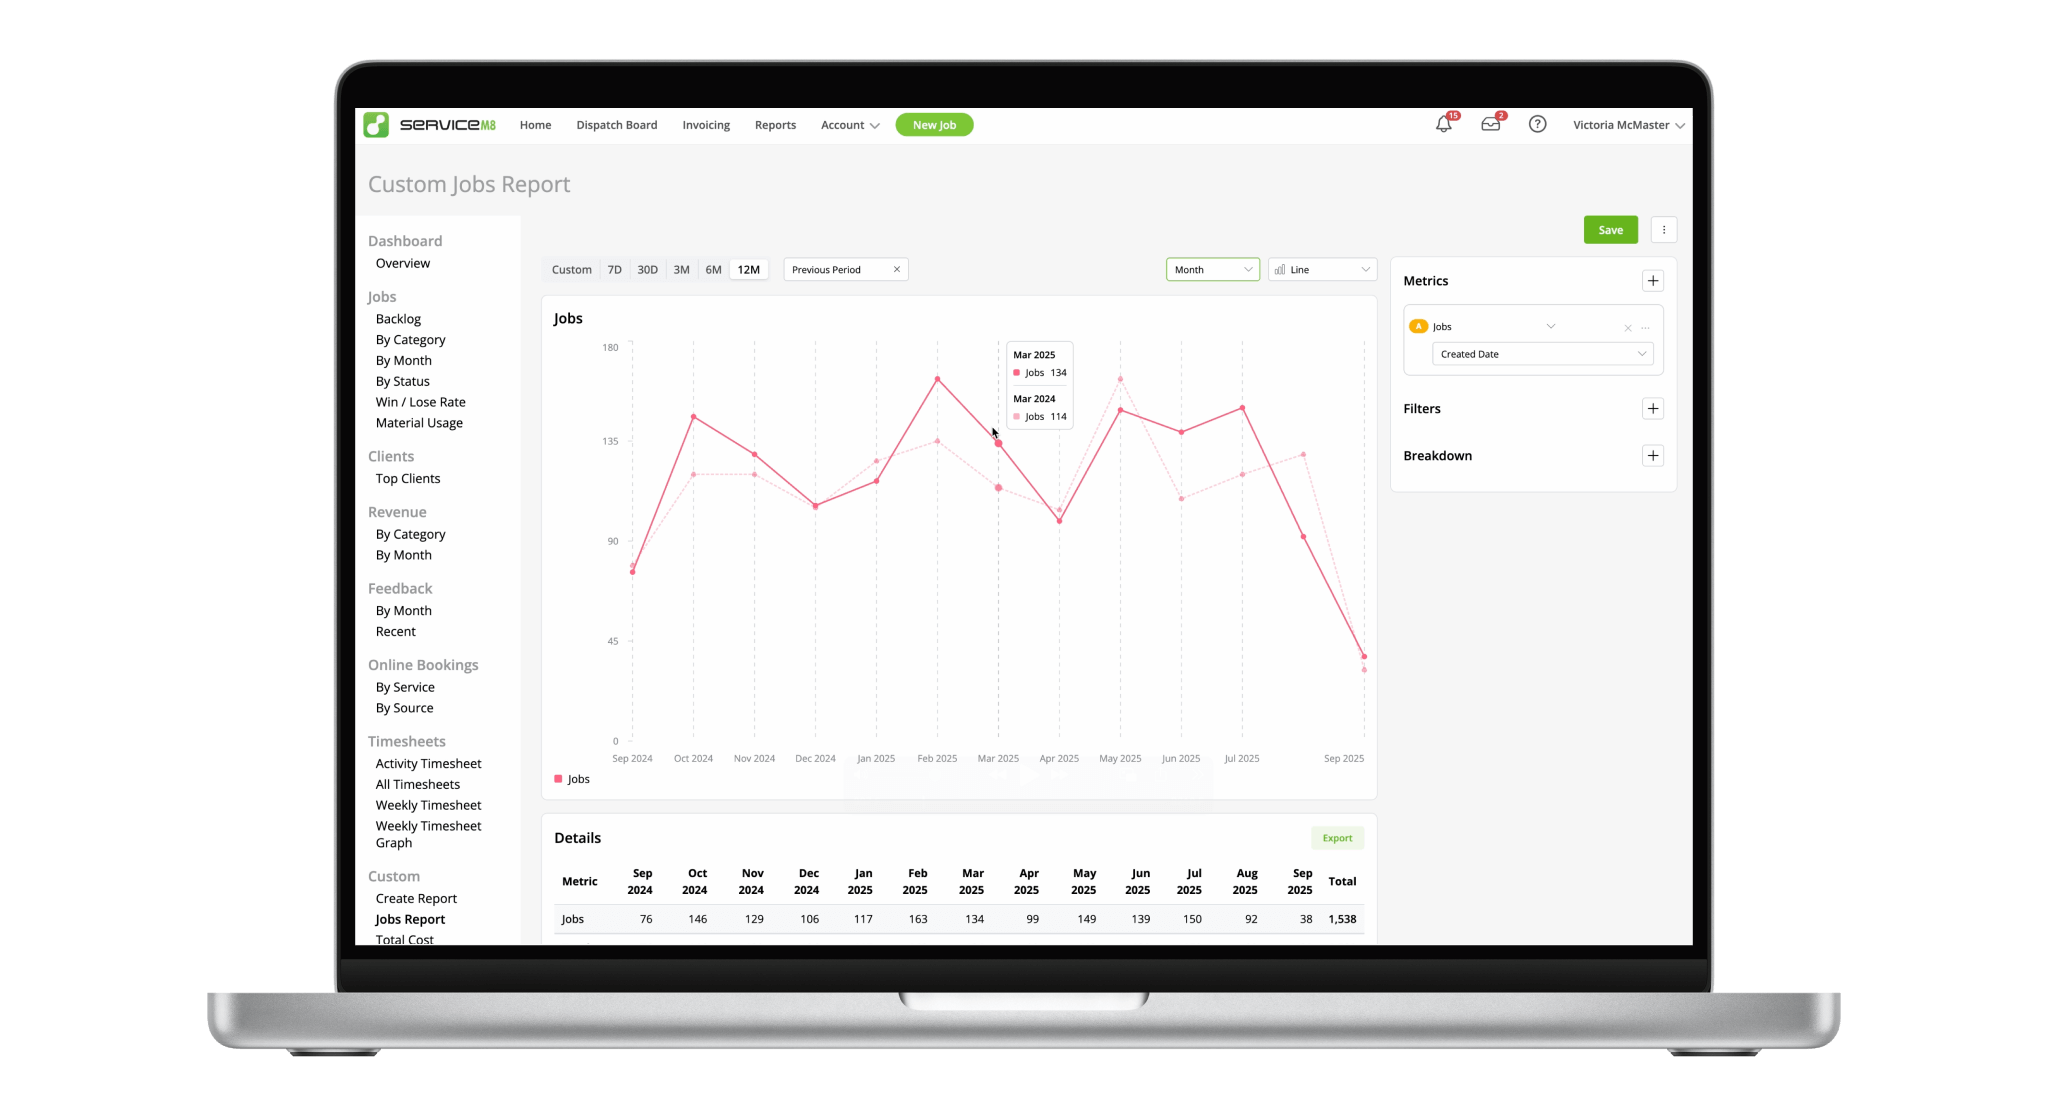
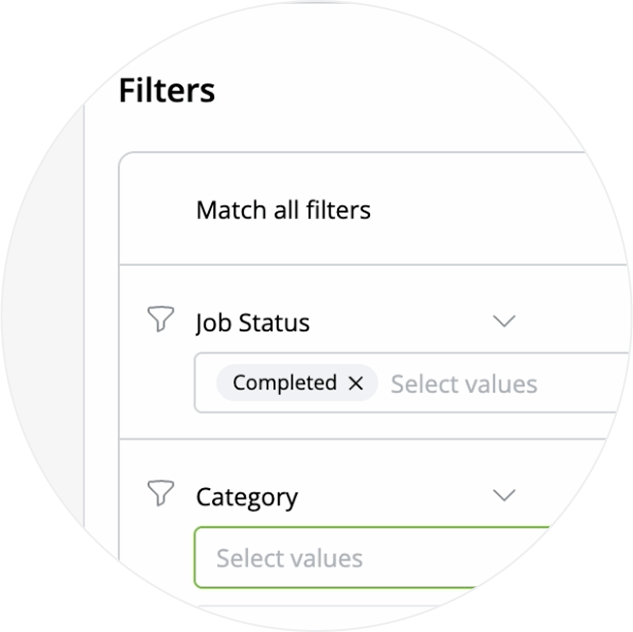
Filter data by Job Status, Category, Client, Profit & much more.
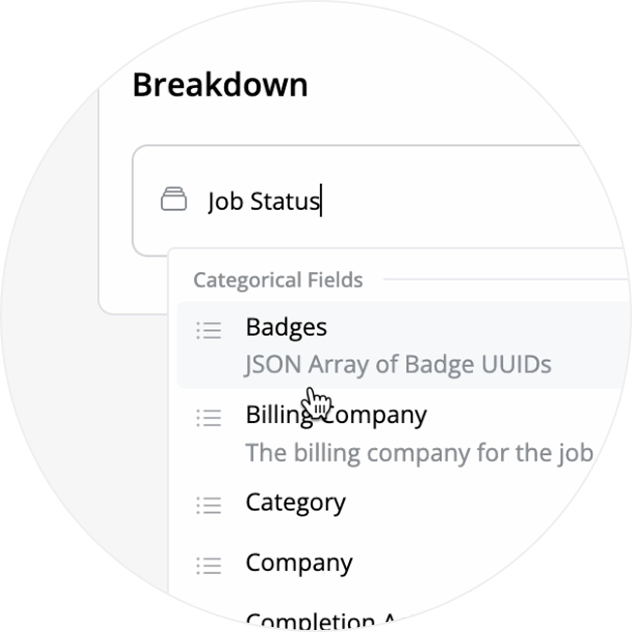
Break the data down by Staff Member, Badge, Location & more, for greater insight.
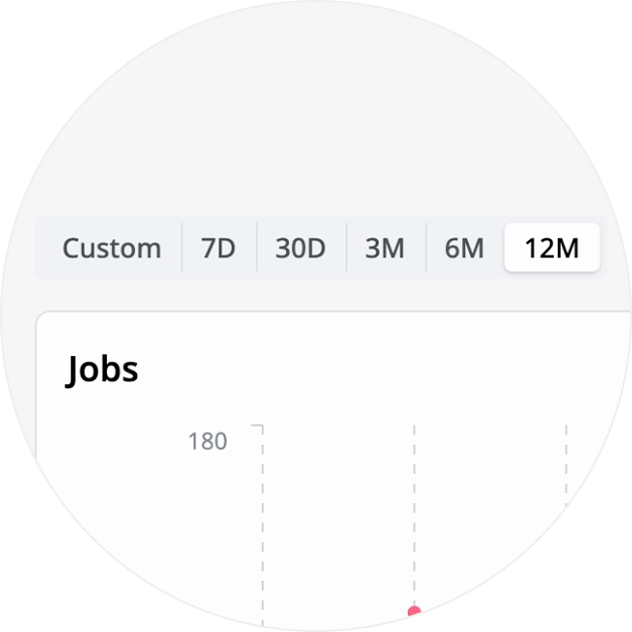
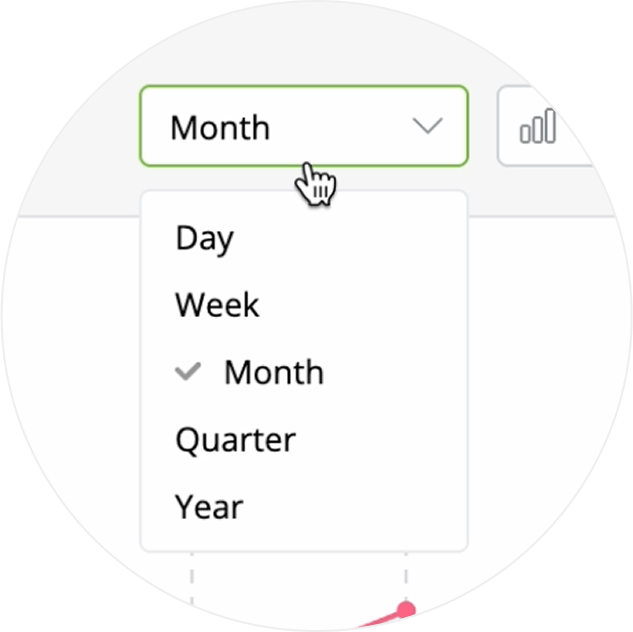
View your data across different time periods, or a custom range.
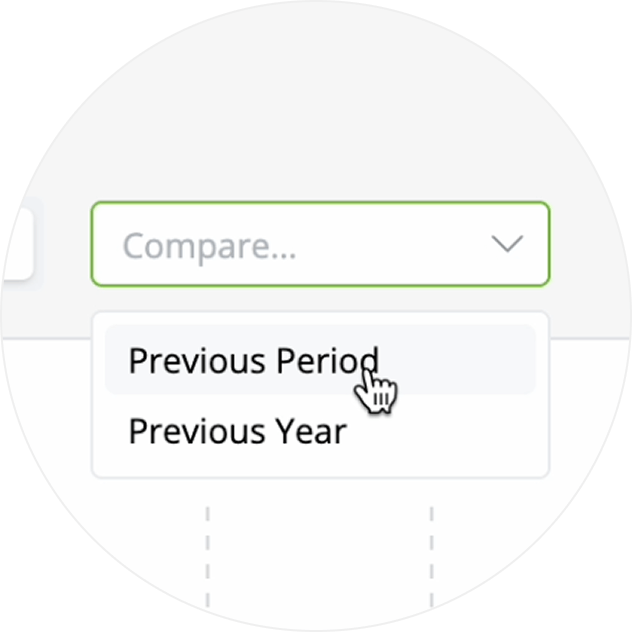
Compare your current data set to the previous period, to see how you’re tracking.
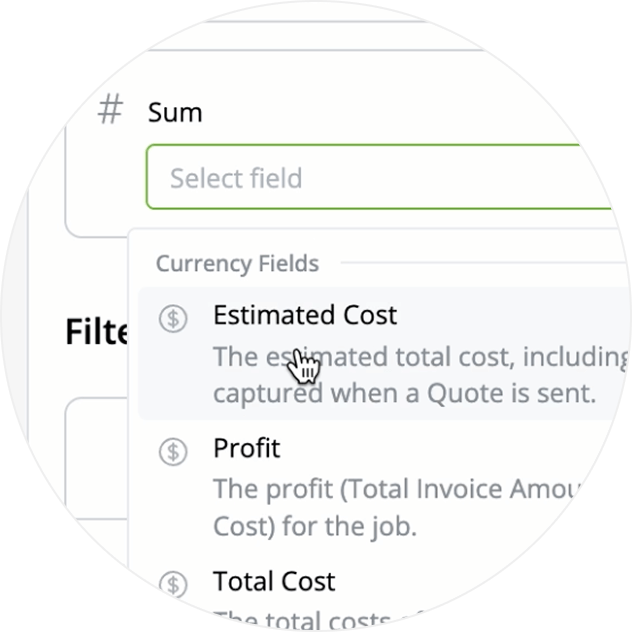
Group results by Cost, Invoiced Amount, Time and more to see meaningful totals and comparisons.
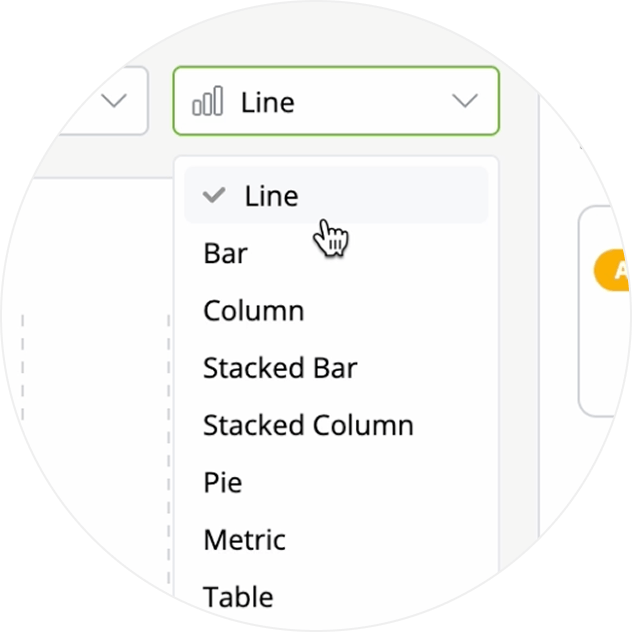
Choose from a range of chart types such as Line, Bar, Column and more to visualise your data.
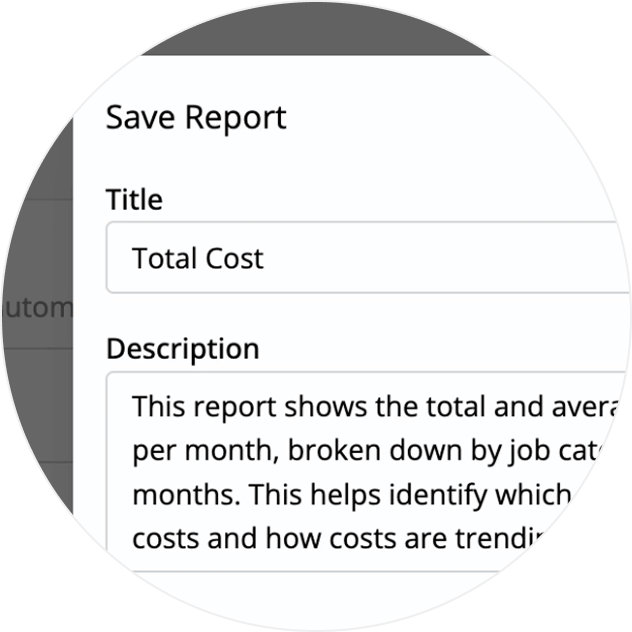
Create custom reports, then save them for quick access next time you’re going over the numbers.
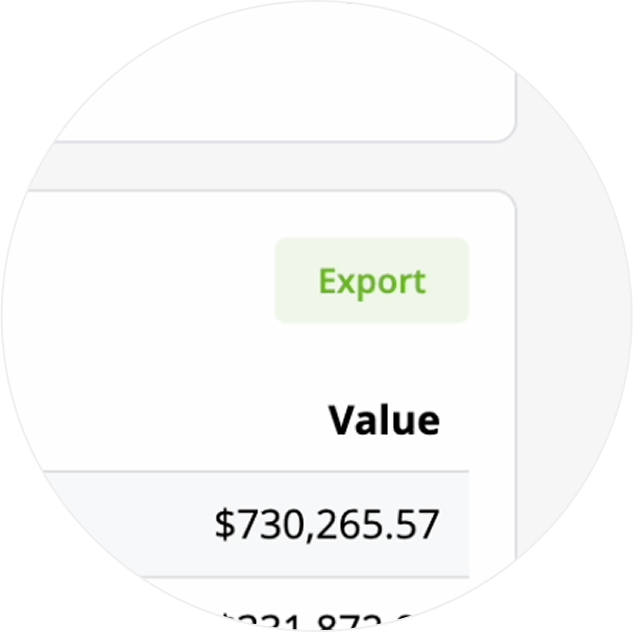
You can export data from a table to a .CSV spreadsheet if you need to.
Time groupings let you adjust the reporting detail, making it easier to identify patterns and outliers.
• How to create custom reports
• Desktop: To activate ServiceM8 14 features & improvements in the Online Dashboard, go to Account > Settings to find the ServiceM8 Launch 2025 notice, and click 'Activate'.
• iOS & Android: The ServiceM8 14 iOS & Android apps are now available in the App Store & Google Play.